UI / UX, Motion & Graphic Design
VIV Explainer Page
A dark, science-led explainer page that turns metabolic data into simple linear graphics.
Client
Datvi Client
Category
UI / UX, Motion & Graphic Design
Designer
David & Ako
Overview & Approach
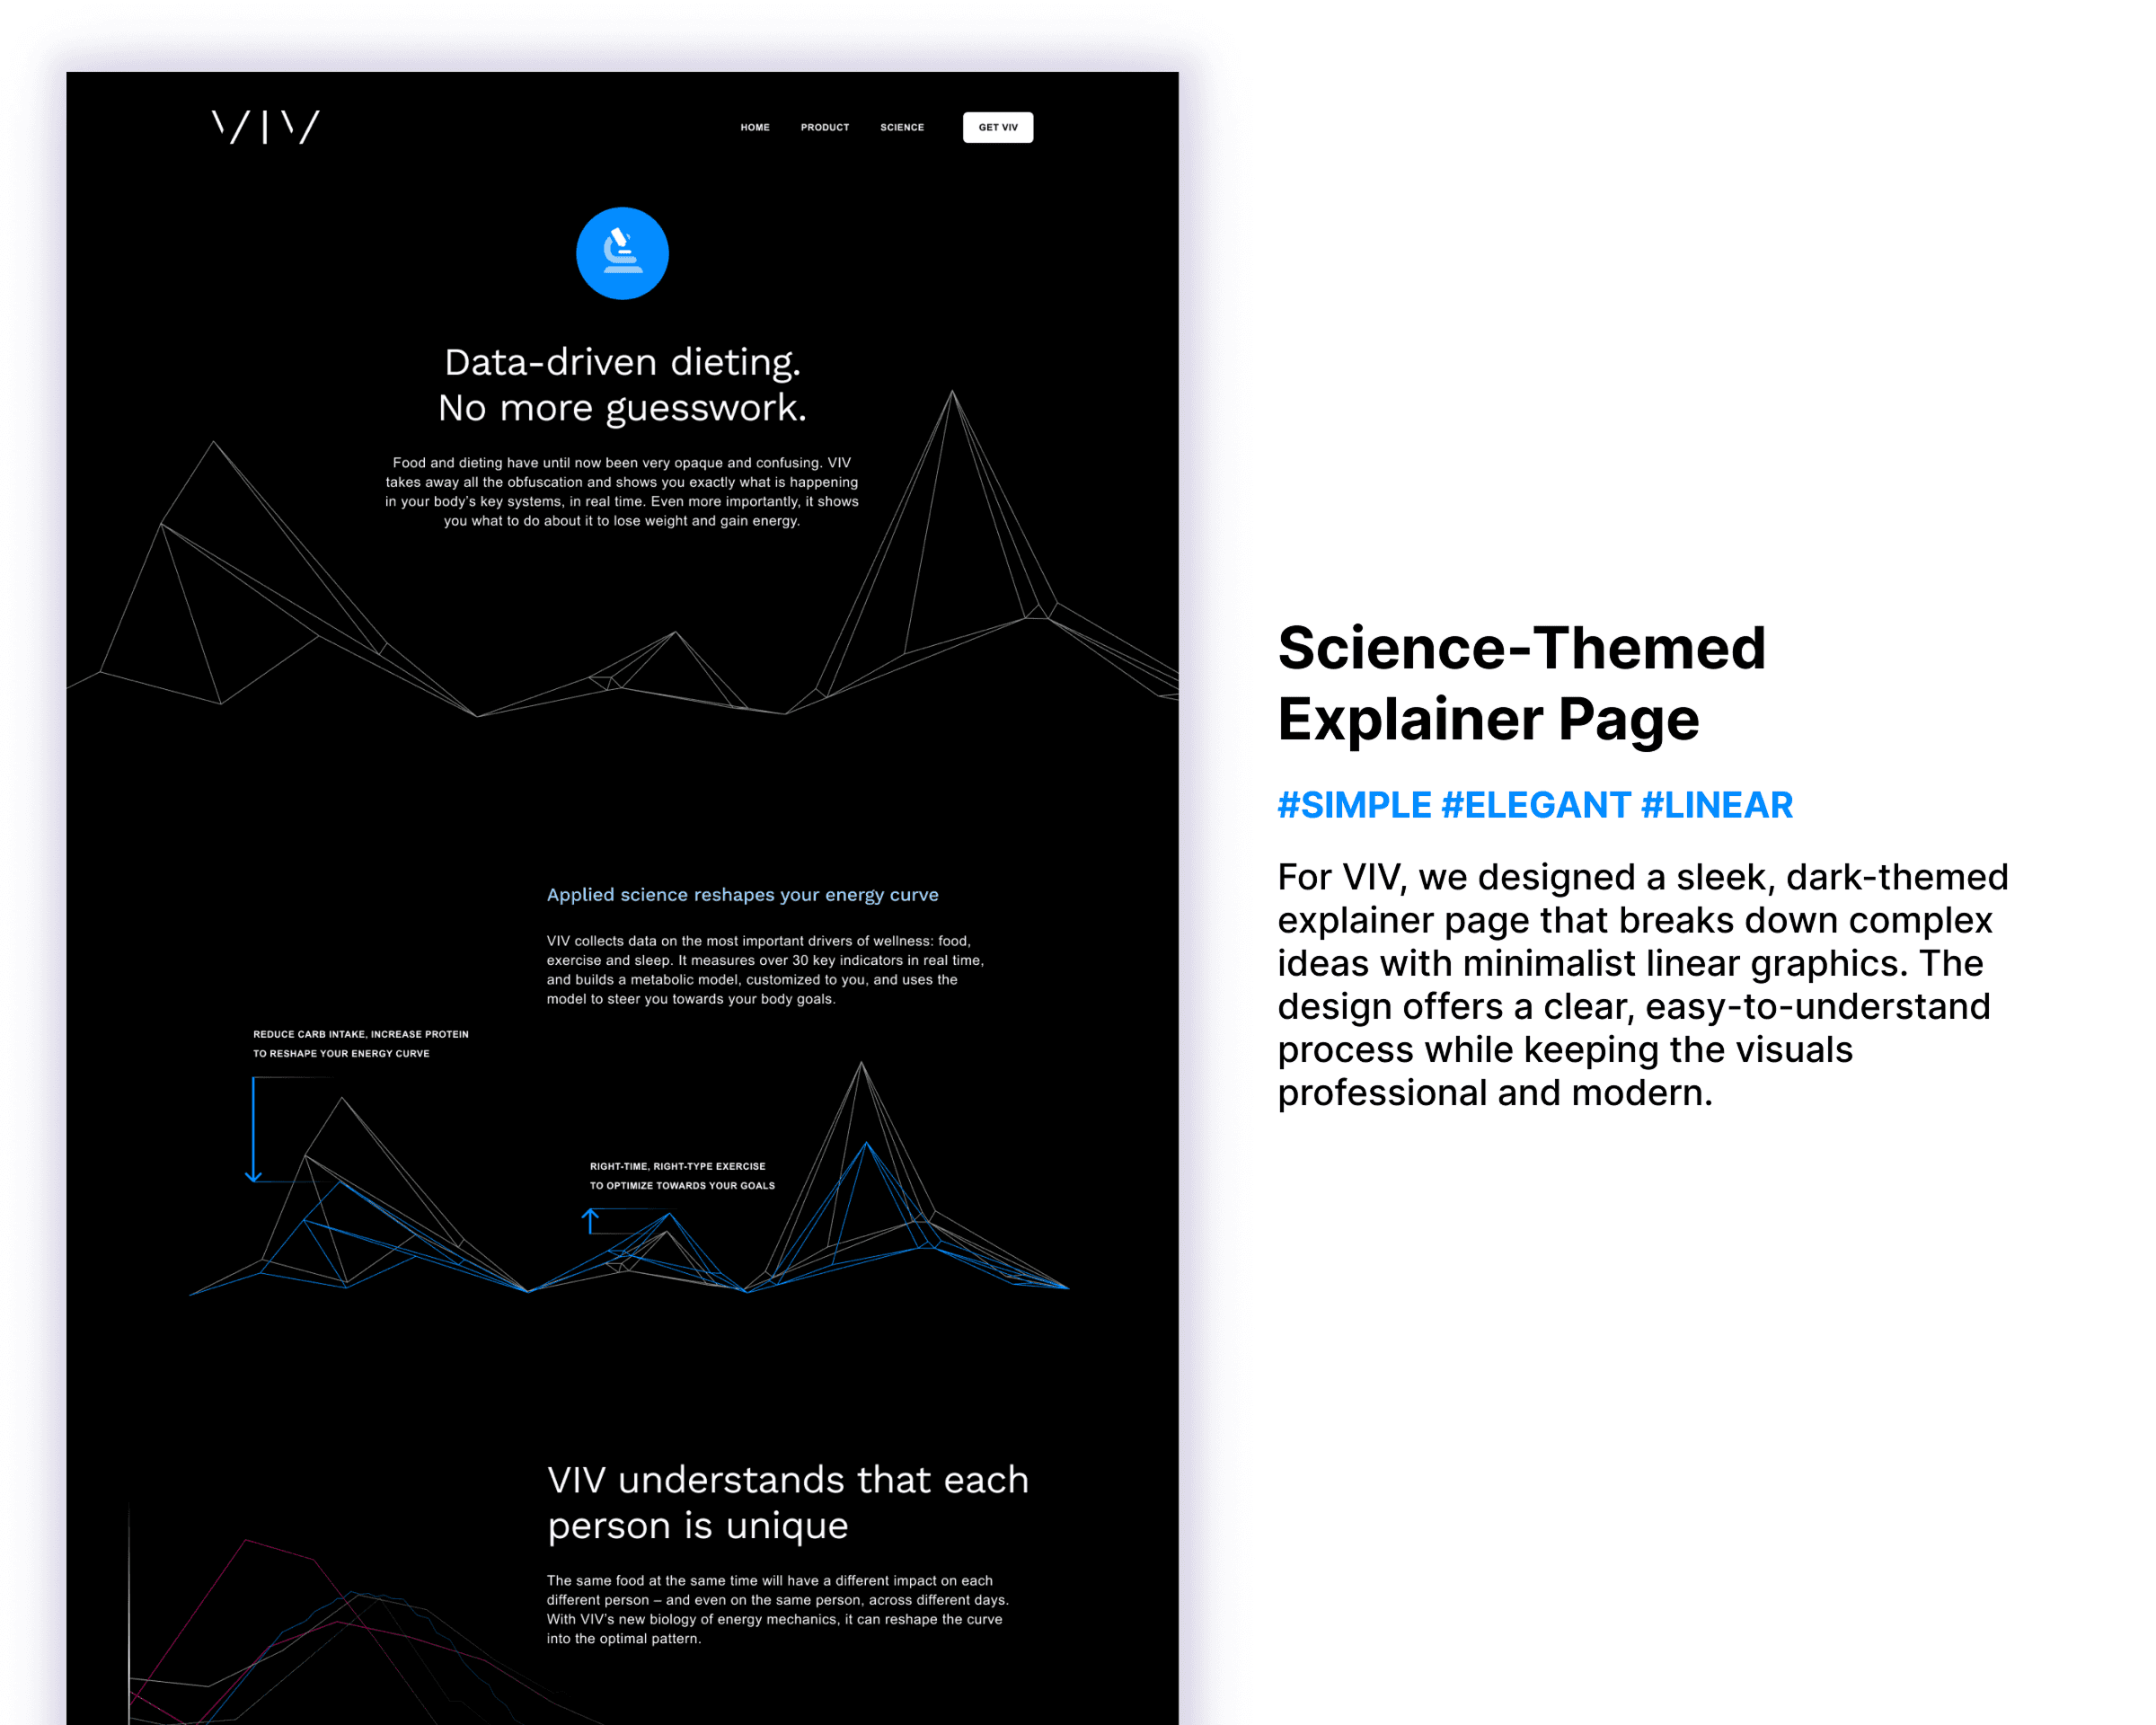
VIV is a data-driven dieting product, and the page opens on "Data-driven dieting. No more guesswork." — explaining that VIV shows what is happening in the body's key systems in real time.
The whole page is drawn with minimal linear graphics: white, blue and red wireframe energy curves running across black, annotated with instructions such as reducing carb intake or timing exercise. Sections cover how applied science reshapes the energy curve — VIV measures over 30 key indicators across food, exercise and sleep to build a personal metabolic model — and how the same food affects each person differently.
Deliverables & Scope
- Web Design
- Data Visualisation
- Graphic Design
- Motion
Create a brief
Interested in similar results for your brand?
Tell us about your goals and schedule a discovery session with David and Ako.